How would you describe your summer vacation with a single word? Some may say "fun" or "relaxing" for example. In Statistics, we have a similar way to describe a collection of data with a single value. One obvious example that comes to mind is the average or mean.
Mathematically, we would describe a data set or variable as a vector or list of values. Thus, we can define the variable X as a list of values:
X = {x1, x2, ... , xn}
We now describe f as a summary function of the list of values:
y = f (x1, x2, ... , xn) or more succinctly: y = f (X )
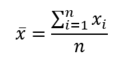
In the case of the mean, we define it as follows:
A summary function is any function which produces a single value from a list of homogeneous values. Examples of homogeneous values would be a collection of heights or weights. In statistics, there are five types of summary functions: measures of quantity, measures of center, measures of spread, measures of position and measures of shape. A summary function applied to a population is known as a parameter. A summary function applied to a sample is called a statistic.
These are measures which describe the data as a whole. One important measure would be the number of items in the data, known in statistics as the sample size or n. Another measure would be the sample sum obtained by adding up all the values.
       X <- 1 1 0 3 9 0 1 4 4 9 ⍝ Create a sample data set
      count X                  ⍝ Sample size n = 10
10
      sum X                    ⍝ Total of all values; sample sum
32
These measures are used to find a typical value or representative of the data.
       mean X                   ⍝ Average value
3.2
      median X                ⍝ Middle value or average of two middle values
2
      mode X                  ⍝ Most frequently occuring value
1
The results of these functions are always positive or zero. Larger values represent greater dispersion; smaller values represent more similar data; 0 represents identical data.
range X ⍝ Difference between largest and smallest
9
var X ⍝ Variance of X
11.51111111
sdev X ⍝ Standard deviation is square root of variance
3.39280284
These functions determine how large or small a value is relative to the rest of a data set, i.e. how much greater or smaller the value is from the middle of the data.
3 quartile X ⍝ Third quartile (or 75th percentile)
4
40 percentile X ⍝ 1 is greater than 40% of all values
1
2 zScore X ⍝ (2 - mean) / sdev
¯0.3536898714
These determine the skewness of the data and the thickeness of the tails.
skewness X ⍝ The data are right skewed
1.044682439
kurtosis X ⍝ The "tails" are thinner than normal
¯0.1488046434